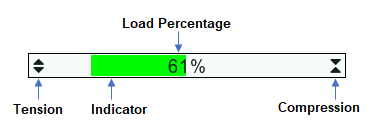
Load Bar Graph
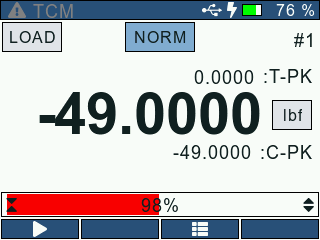
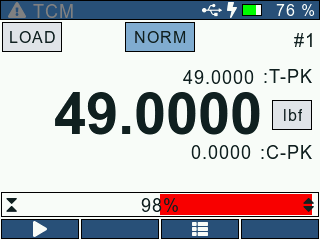
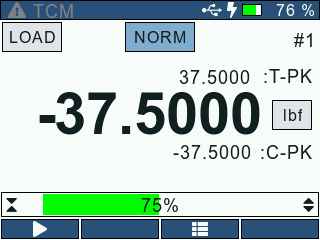
The Load Bar Graph gives the user a visual indication of the absolute load being applied to the gauge. The percentage of applied load with respect to the maximum load capacity of the gauge is also displayed at the centre of the load bar graph. In addition to this, the direction of the load bar graph indicates the type of Load applied i.e compressive or tensile.
The colour of the load bar graph changes depending on the load applied.
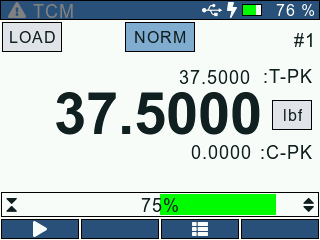
When the applied load is upto 75% of the maximum range, the load bar graph is Green in colour.
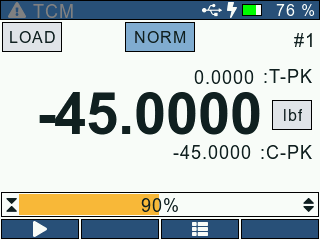
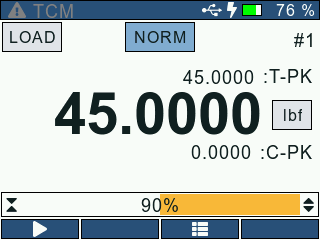
When the applied load is between 75% and 90% of the maximum range, the load bar graph is Yellow in colour.
When the applied load is greater than 90% of the maximum range, the load bar graph is Red in colour.